sagility ltd – Fundamental and Technical View
Company Overview:
Sagility is a global BPM (Business Process Management) company, formerly part of Hinduja Global Solutions (HGS), focusing on healthcare outsourcing and digital transformation services.
Sagility serves Payers (health-insurance companies) and Providers (hospitals, physicians, diagnostics, medical devices) primarily in the U.S. market. Its service offerings span the healthcare value chain, For Payers: enrolment/benefits administration, member engagement, clinical & case management, analytics, payment integrity, claims cost-containment. For Providers: revenue cycle management (billing, coding, AR follow-up), patient access & engagement, lab/medical-device support. Technology and analytics are emphasized: the company uses platforms, document-processing engines, GenAI for customer & member engagement, and automation of revenue cycle operations. The value proposition: A healthcare-specialist BPM services provider (rather than broad IT/BPO), providing domain expertise + cost-effective offshore/onshore model.
Founder: Ramesh Gopalan
Founded In: 2021
Market Cap: Large Cap with Mkt Cap Rs. 24520(Cr.)
Website: www.sagilityheal.com
Sector: Health Care- Insurance
Fundamental Analysis:
Focused on the high-growth US healthcare BPO segment, where demand for outsourcing is increasing.
Consistent revenue growth post-demerger from HGS.
Strong cash flow generation and low debt.
- Promoters are holding 67.40% share, which indicates strong promoter confidence.
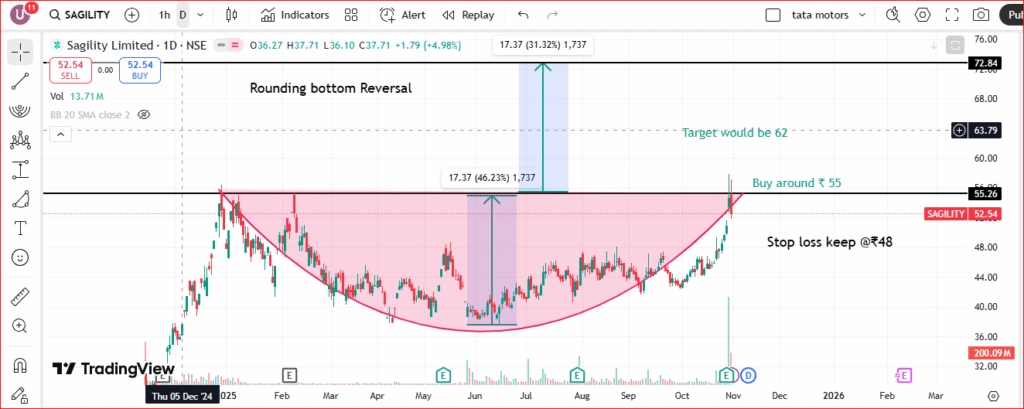
Technical View:
Pattern: Rounding Bottom Reversal
The stock has formed a Rounding Bottom pattern, which signals a long-term trend reversal from bearish to bullish.
Neckline (Resistance): ₹55.26 — this is the key breakout level.
Current Price: ₹52.54 (below the neckline), so breakout not yet confirmed.
Support Zone: ₹45–48.
Buy Zone: Around ₹55 (on confirmed breakout with good volume).
Target 1: ₹62
Target 2 (Full pattern target): ₹72–73
Stop Loss: ₹48 (below recent swing low).
Volume Action
There was a sharp rise in volume during the recent upward move — a bullish sign.
However, for a confirmed breakout, it must close above ₹55 with strong volume for 2 consecutive sessions.
Momentum Indicators (Based on visual cues)
RSI likely approaching overbought zone (~70), so some short-term consolidation is possible.
The rounding bottom suggests medium-term bullishness if the neckline breakout sustains.
Disclaimer: Only for educational purposes no recommendation, before taking the entry please take advice of your financial advisor.