sequent scientific ltd-Fundamental and Technical Analysis view
Company Overview:
- CEO: Manish Gupta
- Founded: 1985
- Small Cap Company, market cap: 4021 (Cr)
- Website: www.sequent.in
- Sector: Pharmaceuticals
Fundamental Analysis:
Profit making company, it is in increasing order from the last 3 years. The company is with low debt. The company has a good dividend track report and has consistently declared dividends for the last 5 years.
| Quarterly | Jun 2020 | Mar 2020 | Dec 2019 | Sep 2019 | Jun 2019 |
|---|---|---|---|---|---|
| Sales | 59 | 62 | 61 | 51 | 52 |
| Other Income | 2 | 3 | 2 | 7 | 2 |
| Total Income | 61 | 65 | 63 | 58 | 54 |
| Total Expenditure | 51 | 54 | 58 | 50 | 51 |
| EBIT | 9 | 11 | 5 | 7 | 2 |
| Interest | 1 | 1 | 1 | 1 | 1 |
| Tax | 1 | 3 | 1 | -3 | — |
| Net Profit | 6 | 6 | 2 | 10 | 1 |
In this pandemic situation of COVID – 19 all businesses were closed but only Pharma sector was performed well because of pharma sector has got medicine orders hence business never stopped and that is essential, other businesses affected a lot by profit margin but Pharma is performing well.
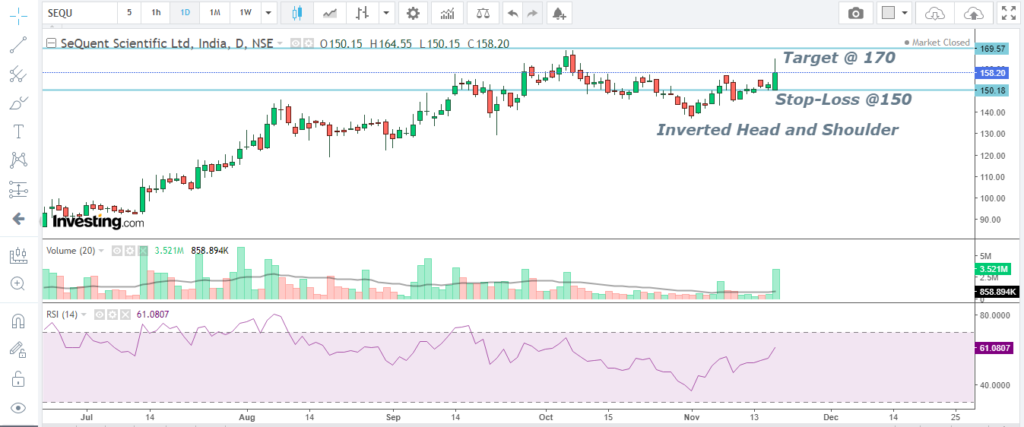
Technical View:
Inverted Head and Shoulder found on the chart on daily basis. Price has given positive breakout on the weekly candle, this chart expecting positive movement in short -term. The breakout point is 156 buy above 158 and keeps the stop loss on 150, for the target 170 for short-term and 186 medium-term.
Disclaimer: Only for educational purposes no recommendation, before taking the entry please take advice of your financial advisor.